
In this tutorial, we will look more closely at SolveSpace's two-dimensional drawing tools. SolveSpace is a 3d CAD program; but if we want, then we can still draw, dimension, and export a 2d sketch, without using any of the 3d features. These tools are also useful in 3d parts, for example while drawing a plane sketch to be lathed or extruded.
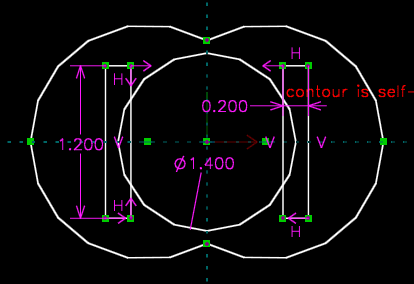
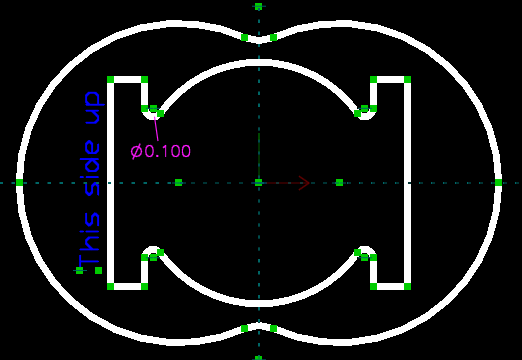
We wish to draw the following sketch:
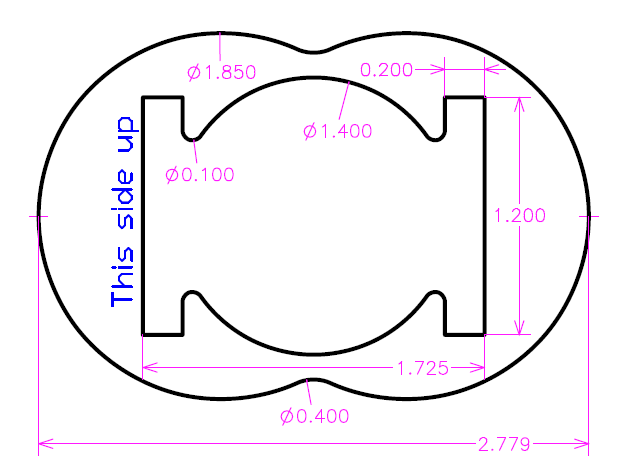
The dimensions on the drawing above do not fully describe the part; but the part is obviously symmetric, and we will add constraints on that. We will leave the remaining degrees of freedom unconstrained, so that we are still free to drag them with the mouse.
The sharp corners that would be present where two lines or circles join have been rounded, with tangent arcs. We will begin by drawing the part without those smooth corners, and round off the corners as one of our final steps. We will also change the line styles, to make the contour use a fatter line, and make the text appear stroked in blue.
Note that we are working in inches, not millimeters. To set the view units to inches, choose View → Dimensions in Inches. It's possible to switch between inch and mm units at any time. This setting changes how dimensions are displayed and entered, but it doesn't change the geometry. So a line that was dimensioned as 1.000 inches, for example, will be dimensioned as 25.40 mm if we switch to millimeter units.
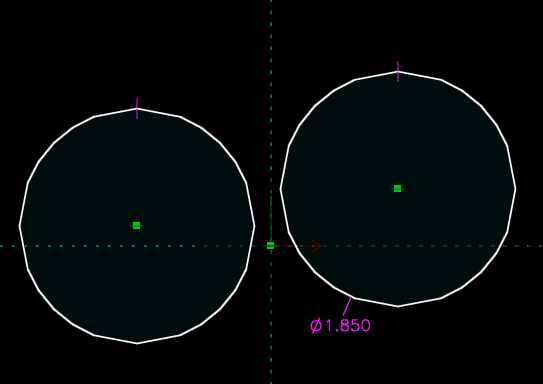
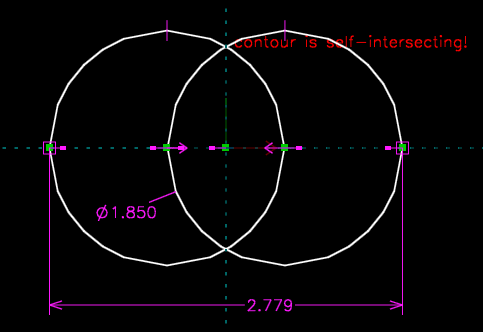
We will begin by drawing the outer contour, from two circles. We could do this by drawing two arcs, and constraining them; but it's easier to start with two circles. They will overlap, but we can split them and trim out the undesired portions later. So we draw two circles, in approximately the right locations, by choosing Sketch → Circle and then left-clicking the center and radius. We constrain them to have equal radius (left-click each circle to select it, so that it appears in red, and choose Constrain → Equal Radius), and constrain the diameter of one of the circles to 1.850 inches (left-click that circle to select it, and then choose Constrain → Diameter; then double click the label on the sketch, and type 1.850). Since the circles have been constrained equal radius, both circles now have diameter of 1.850 inches.
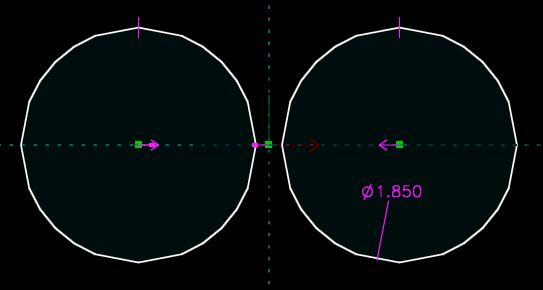
The circles should be placed symmetrically about the origin. So left-click each circle's center to select it, and then choose Constrain → Symmetric. Since the centers are roughly horizontal already, the program infers that we want symmetry about the vertical coordinate axis. Finally, the circles should be placed so that their centers lie on the horizontal coordinate axis; so select the center of one of the circles, select the origin, and choose Constrain → Horizontal. This forces the center of the circle to lie on a horizontal line through the origin.
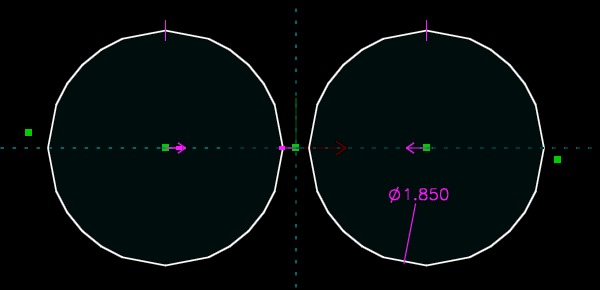
We now wish to place the dimension on the overall width of the part, which should be 2.779 inches. There's no constraint that will do this directly, so we need to place a couple of datum points. We can do this by choosing Sketch → Datum Point, and left-clicking near the desired location of the point; in this case, the left edge of the part. We then repeat the process, at the right edge of the part. We now have two unconstrained datum points in the sketch:
We wish to place the datum point on the left at the leftmost point on the left circle. This means that it lies on the circle itself, and on the horizontal coordinate axis. We do this with two constraints. First, we select the point, and select the circle, and choose Constrain → On Curve. The point is now constrained to lie on the circle. Then, we select the origin, and select the datum point, and choose Constrain → Horizontal. The point is now locked in place, with respect to the circle. We repeat the process for the rightmost point and circle.
The sketch now has a single degree of freedom, corresponding to the distance between the two circles. We can constrain that with a dimension on the distance between our two datum points. So we select those two points, and choose Constrain → Distance. We then double-click the label on the dimension, and type 2.779 inches, and the sketch is adjusted accordingly.
Our circles are now in the correct positions. But we don't want two circles; we want two arcs, so we want to trim out the part where they intersect. We can do that by first splitting the circles where they cross over each other, and then removing the parts that we don't want. So we begin by selecting the two circles, and choosing Sketch → Split Curves at Intersection. Each circle is split into two arcs:

(The point that was created as a result of the split is shown in red here.) There's still one intersection remaining, so we select the two pieces again, and choose Sketch → Split Curves at Intersection. The intersections have now all been removed, so the warning about our contour disappears. We can select the two inner pieces of the circles, which appear highlighted below in red:
We then choose Edit → Delete, and those two pieces disappear, leaving us with our outer curve. We still haven't rounded the sharp corner where the two circles join, but we'll do that last.
Note that when we split our circles, they were deleted, and replaced with new arcs. This means that we lost the constraints on the original circles. So the arcs are in the correct place, but they're not actually constrained there—we could drag them somewhere bad with the mouse. If we wanted to avoid that, then we could have made the circles "construction" entities before splitting, and the circles and their constraints would have been kept; but in that case, those construction entities would have cluttered the drawing somewhat. This is a tradeoff, and depending on what we're drawing, we might choose to keep (as construction) or discard (like we did now) the original entities.
We also might as well delete the 2.779 inch dimension, since the entities that it was controlling are gone. So left-click that, and then choose Edit → Delete.
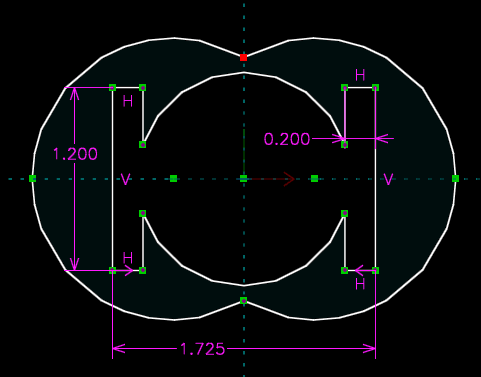
Next, we'll draw the inner cutout. Once again, we'll draw some overlapping shapes, and trim out the pieces that we don't want, to make a single contour. In this case, it's a circle (Sketch → Circle), and two rectangles (Sketch → Rectangle).
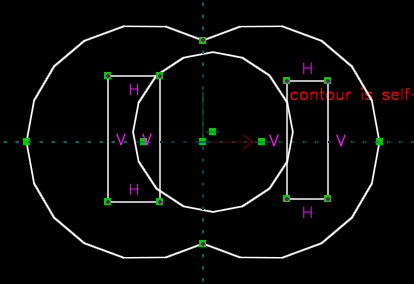
The circle should be centered at the origin. So we select the center of the circle, and the origin, and choose Constrain → On Point. The two rectangles should be identical, and placed symmetrically about the original. So we select the bottom left corner of the left rectangle, and the bottom right corner of the right rectangle, and choose Constrain → Symmetric. We then repeat this with the top right corner of the left rectangle, and the top left corner of the right rectangle. (This makes sense; by specifying two diagonally opposite corners of the rectangle, we specify the rectangle completely.) Finally, the rectangles themselves should be symmetric about the horizontal coordinate axis; so we select one of the vertical edges of a rectangle, and choose Constrain → Symmetric. In combination with our first two constraints, that forces both rectangles to lie symmetrically about that horizontal coordinate axis:
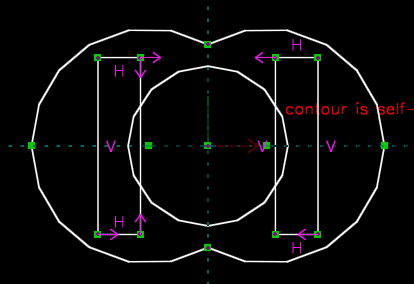
We now can dimension the diameter of the circle (select the circle, then Constrain → Diameter), and the lengths of the two edges of one of the rectangles (select the line, then Constrain → Distance).
This leaves the inner contour with only one degree of freedom (though the overall sketch has more, because the outer circles aren't constrained), which we can manipulated by dragging the rectangles horizontally. We constrain that degree of freedom when we place the 1.725 inch dimension; so select the leftmost point at the bottom of the left rectangle, and the rightmost point at the bottom of the right rectangle, and choose Constrain → Distance.
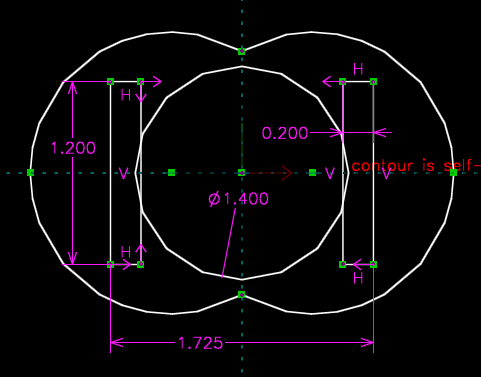
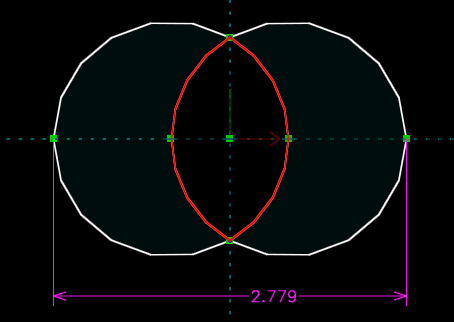
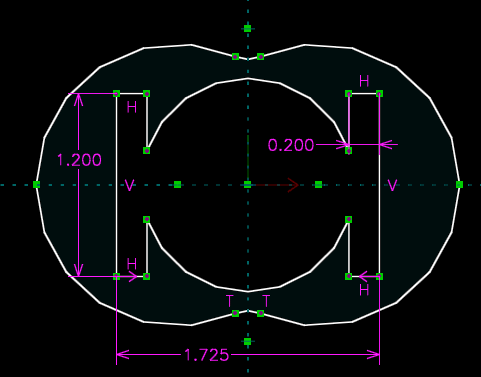
This completes the inner contour. We now wish to split the entities to remove the self-intersections (that we are warned about on the sketch), and remove the unwanted portions of the curves, the same as before. So we select the circle and one of the lines, and choose Sketch → Split Curves at Intersection. We do this a total of four times, twice on each side (since there are two intersections on each side). We then select the inner pieces of the curves, four in all:
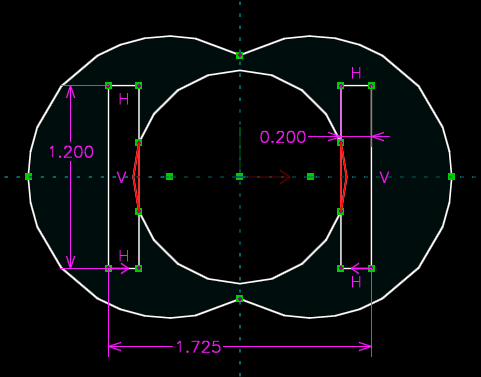
As before, we choose Edit → Delete, and the warning disappears, since we once again have a correctly-formed contour. We've now drawn both the inner and outer portions of our contour, but they still have sharp corners where the entities intersect.
To round these, we will use the "Tangent Arc" tool. We can start by setting up some parameters of that tool. So with nothing selected, choose Sketch → Tangent Arc at Point. In the text window, we see that by default, the radius of this arc will be chosen automatically. This is not what we want, so we left-click to un-check that box. We now can enter our desired radius, which for the outer contour is 0.200 inches. (It was given as a diameter on the drawing, but we want a radius here. If we prefer, then we could instead type "0.400/2"; it's generally possible to specify an arithmetic expression anywhere that a number is expected.)
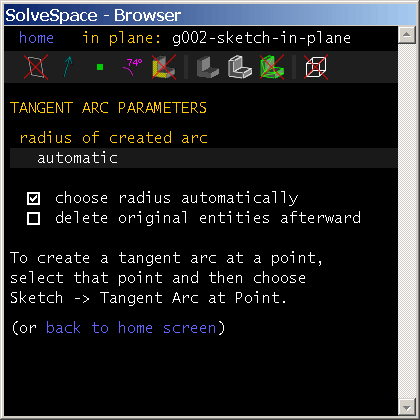
We also see that by default, the original un-rounded entities will be kept, since the "delete original entities" box is not checked. We would prefer to delete those, to avoid cluttering the sketch, so click to check that box. The settings now appear as below:

So we are ready to actually round the corners. Left click the top point where the two outer circles join, so that it appears highlighted in red:
Then choose Sketch → Tangent Arc at Point. Since a point was selected, this rounds (or fillets) the curve at that point. This operation may sometimes fail, especially on curves (instead of lines). This is usually because of a real problem, like a tangent arc with a radius so big that it won't fit within the length of an existing line; but especially when rounding the join between two curves, the program may sometimes fail to find a valid solution. In any case, it's usually possible to fix the problem by specifying a smaller radius.
But in our case, the tangent arc worked like we expected. So we can repeat the process for the bottom point where the circles join; by default, it will use the same radius as before. This completes the outer contour:
For the inner contour, we wish to use a different radius: 0.050 inch (or the diameter of 0.100/2). So we choose Sketch → Tangent Arc at Point with nothing selected, to view the screen in the text window again. We enter our new radius of 0.050 inches, and leave the other settings unchanged. We then select one of the points to be rounded, and choose Sketch → Tangent Arc at Point.
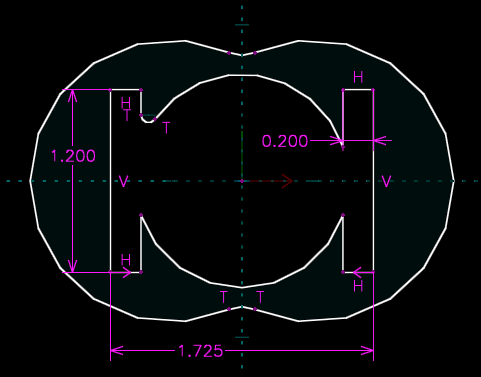
Note that points are hidden in the above image, by clicking the appropriate icon in the strip at the top of the text window. The points would otherwise clutter the view, and obscure the small arc.
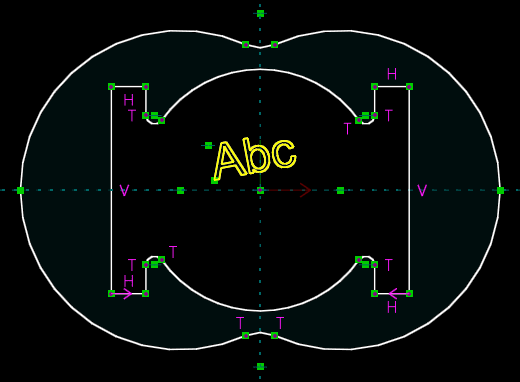
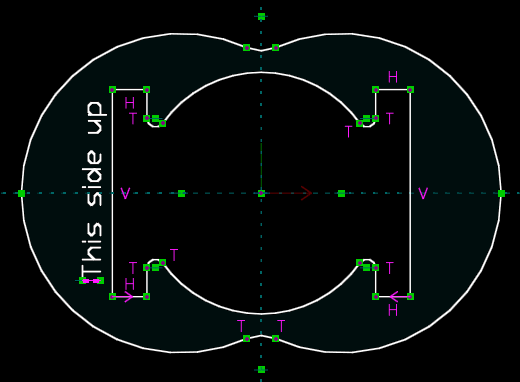
We repeat the process for the remaining three sharp corners, by selecting that point and then choosing Sketch → Tangent Arc at Point. So we've now drawn all the geometry, although we've also lost some of our constraints (since the lines and curves that were constrained have been deleted when we rounded the corners). So we might as well delete the remaining dimensions, so that they don't clutter our sketch.
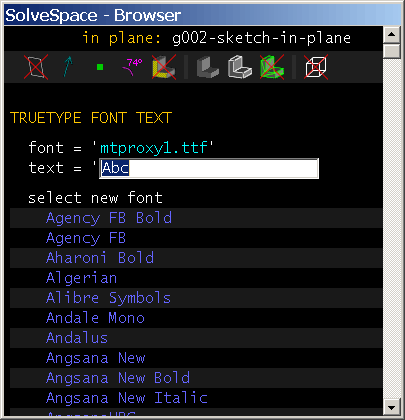
We still have to add the text, and set the thickness and color of the lines. To add the text, we choose Sketch → Text in a TrueType font. We then left-click once on the drawing, to define the top left point of the text, and click again to define the bottom left. By default, the text will consist of the letters "Abc", and the font will be Arial. To change these, we left-click the text to select it. A description of the text appears in the text window, along with a list of available fonts. (Any TrueType font installed through Windows will be available here; the exact list will vary with what programs and special fonts you have chosen to install.) To select a font, click it in that list.
Then to change the text, we scroll to the top of the text window. The current text ("Abc") is listed, and a link next to that text permits us to change the text. We click that link, type the new string in the text box, and hit Enter to confirm. The text will change, both in the text window and on the drawing.
We then can drag the text into the desired position. To do so, we can either drag one of the points (which leaves the other point stationary, which means that we change the size of the text), or drag the text itself (which means that we drag both points, so we just move the text, without changing its size or rotation). Since we want the text to be vertical, we want those two points to be horizontal; so we can enforce that with a constraint, by selecting the two points and choosing Constrain → Horizontal, instead of trying to drag them exactly into place. We then can drag the points or the text to place the text with the desired position and scale.
So we've now placed all the desired entities. The only thing left is to set the line styles, so that the contour of the part is drawn with a thick line, and the text is drawn in blue. In SolveSpace, it is never possible to change the thickness (or color, etc.) of a line directly. Instead, we should create a style, assign the curve or line to that style, and then change the color or thickness of all lines with that style. Styles in SolveSpace behave somewhat like layers in certain other programs.
Initially, a number of standard styles exist. For example, there is a style that specifies that by default, constraints are drawn in magenta, and that lines are drawn in white, and that points are drawn in green. We could change any of those styles if we didn't like the default colors and line widths. But for this part, we would like to keep the defaults unchanged, and create a custom style just for these lines.
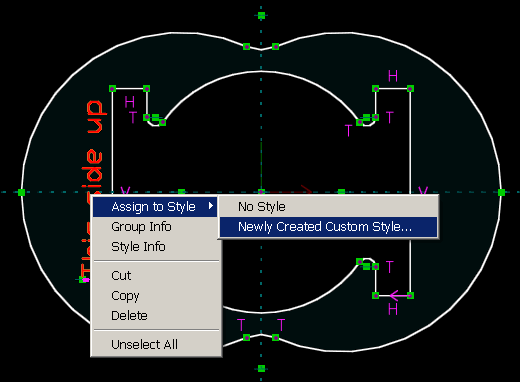
We can start with the text, by right-clicking it. We choose Assign to Style from the context menu, and we see a list of existing custom styles. Since we haven't created any custom styles yet, the only options in that list are either no custom style (which is what the text has now), or to create a new custom style.
We choose the latter. Initially, nothing changes, since the new custom style is created with the same line width and color as the default style. But in the text window, we see a description of our new style, which we can edit according to our preference. First, we should name the style something meaningful, by clicking the "rename" link at the top of the page. We might, for example, choose to name it "blue-text". We then want the text to be blue, so for the line stroke, we specify a color of 0, 0, 1 (i.e., all blue; the colors are specified as r, g, b). So we click the "change" link next to the line stroke color, type that new color, and press Enter. We see that on the drawing, the text turns blue.
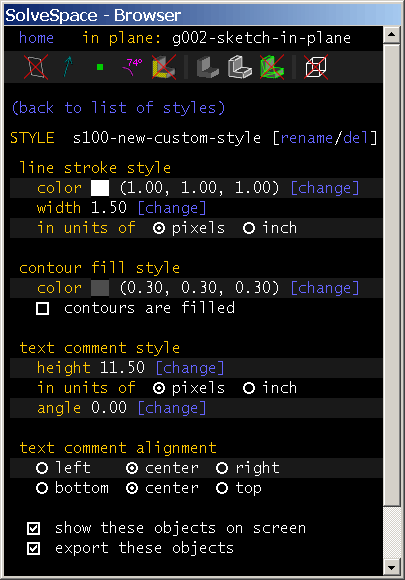
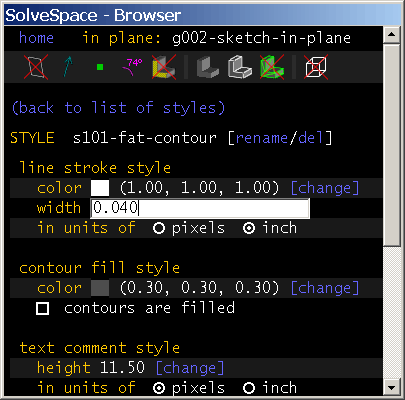
So we've changed the text to blue, but we still need to make the contour of the part thick. We can do that by creating another custom style. We right-click any curve from the contour of the part, and choose Assign to Style → Newly Created Custom Style. We again see a screen with information about this style. So we should again rename it to something meaningful, like "fat-contour". We are happy with the color, but we want to change the line width. First, we want to specify the line width in inches, and not pixels. By default, lines have constant width in pixels. This means that as we zoom in on the drawing, the lines don't get fatter. But we can also specify the line width in inches; in that case, as we zoom in, the line will look fatter, and as we zoom out, it will look skinnier. The latter is what we want, so we select the appropriate radio button. We then specify our desired width, of 0.040".
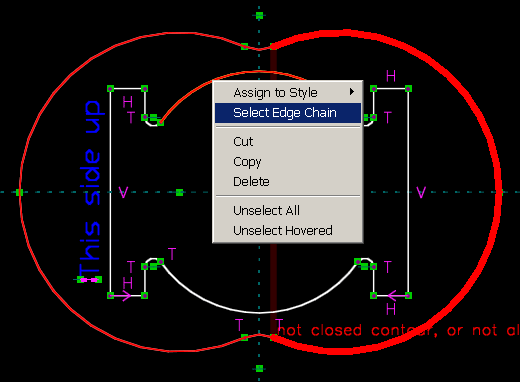
This has changed the style, but only for the one arc that we had initially selected. So we still need to assign all of the lines and curves to our new style. We do that by first selecting them. We could select the entities by left-clicking each one in turn; but it's quicker to just right-click any curve from the outer contour, and then choose Select Edge Chain. This selects all of the entities that share endpoints with that initial curve, so it selects the entire loop in a single operation. We repeat the process for the inner contour, so that all of the desired entities are selected.
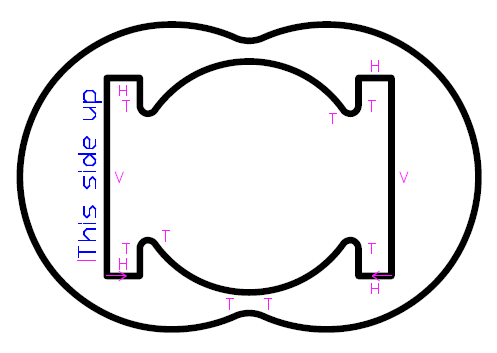
Then, we right-click, and choose Assign to Style → s101-fat-contour. (Of course, that style could be named differently, depending what name we had chosen to give it.) The outer contour is now drawn with a thick line everywhere.
If we wanted to change something about the styles—for example, if we wanted to change the color of the contour from white to green—then we could go back to the list of styles, and edit the appropriate style (in this case, s101-fat-contour) accordingly. From the home screen of the text window (click the link at the top left of the window, or press Esc a few times), we choose the "line styles" link at the bottom of the page. We now see a list of all the styles. The list is long, because it includes all the default styles:
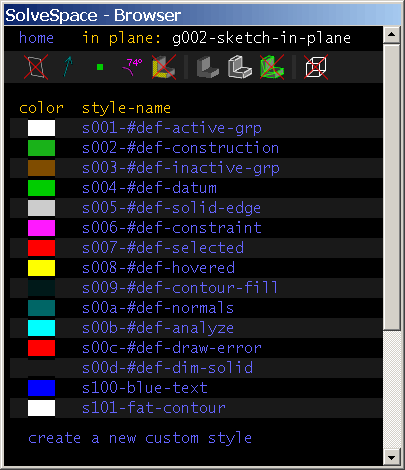
(The default styles can be identified by the string "#def" in their names.) We can modify any of the styles. So to return to the screen for our s101-fat-contour, we click its entry in the list. Any changes to the style will be applied to all members of the style, so we can change the color of the entire contour (for example) in a single operation. We could also have reached the screen for a style by right-clicking a line or curve assigned to that style, and choosing Style Info from the context menu.
This completes the part. So we could export the part in a variety of formats. If we just choose File → Export View, and export the file in some graphics format (for example, PDF or SVG or EPS; we chose PDF here), then we will get a view like this:
So we see almost the same thing as on the screen, including all of the remaining constraints. (We note that the white lines have been changed to black. By default, SolveSpace changes white (or almost white) lines to black when exporting file formats that are typically displayed with a white background. We can disable that behavior by de-selecting "fix white exported lines" in the configuration screen.) If we want to export just the lines and curves, and not the constraints, then we should hide the constraints, by clicking the appropriate icon at the top of the text window.
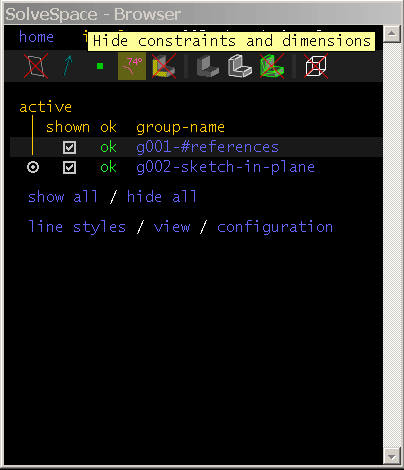
The constraints now disappear on-screen, and if we again choose File → Export View, then they will disappear from the exported file as well.
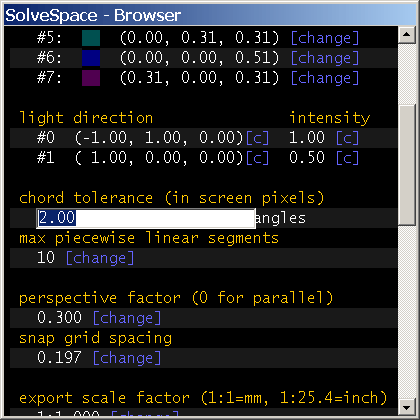
Since we exported as a PDF, and PDF can represent smooth curves exactly, the curves looked smooth in the exported file. This is typically what we want, but in some cases, we would like to break curves down into line segments. (For example, some CAM software can't accept files with curves in them.) To do this, we would select the "export curves as piecewise linear" checkbox in the configuration screen. This forces the exported file to contain only line segments, with all curves converted to line segments using the same chord tolerance as on-screen.
The "chord tolerance" is a measure of the maximum error between a curve and the line that approximates it. For example, if the chord tolerance is 5 pixels, then the distance between a curve and the line that approximates it will never be more than 5 pixels. A chord tolerance around 0.5 pixels will make curves look perfectly smooth on screen (since the error ends up less than a pixel, so it almost disappears). The default chord tolerance is 2 pixels. This makes curves look a little bit blocky, but it also makes the program run faster, especially when working with large solid models. (The same chord tolerance is used with the solid models, for example when generating a triangle mesh from surfaces.)
Since the chord tolerance is mostly just a cosmetic adjustment, we should generally leave that as coarse as possible. It's always possible to choose a finer chord tolerance later, and regenerate the model with finer detail for export.
If we want to export a dimensioned drawing of our part, then we could show constraints again, and place the desired constraints on our part, and export that view. But in some cases, we may want to export a dimensioned drawing of the part, but with a different set of dimensions from the ones that we use to define the geometry. For example, we might not wish to show things like symmetry constraints, since those are obvious to the viewer. Or we might want to show the user a different set of linear dimensions from the ones that we use to define the part. (For example, we might specify a rectangle by the length of its diagonal and its aspect ratio, but want to dimension the lengths of its two sides.)
To do that, we can create another group, and place reference dimensions on the existing geometry. These reference dimensions can't change the geometry; they just display a value (like a length, or an angle, or a distance) to the user. So we can place any combination of reference dimensions that we want, regardless of how the geometry was initially specified.
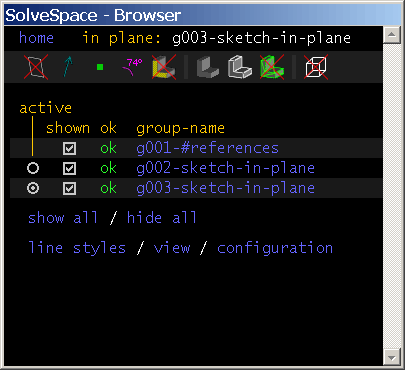
To create the new group, we can select the origin of the part, and choose New Group → Sketch in New Workplane. This creates a new group, locked into a workplane (so that we're drawing and constraining in 2d), with that workplane centered at the origin. By default, it snaps to the nearest workplane orthogonal to the coordinate axes. Since we were looking onto the XY plane, that's the XY plane. If we were working in 3d, or if we wanted to rotate our coordinate system in 2d, then we might have chosen something else.
This creates a new group. If we return to the home screen in the text window (by clicking the link at the top left, or pressing Esc a few times), then we see that there are now two sketch groups in our file: g002-..., which contains the lines and curves that we've drawn, and g003-..., which is the new empty group we've just created for our dimensions. The new group is active, as we can see from its radio button in the "active" column at the far left. If we wanted to go back and make changes to the lines and curves, then we could do so by activating g002-.., by clicking its radio button in that column. But now, we want to create our dimensions in g003, so we want g003 to be active.
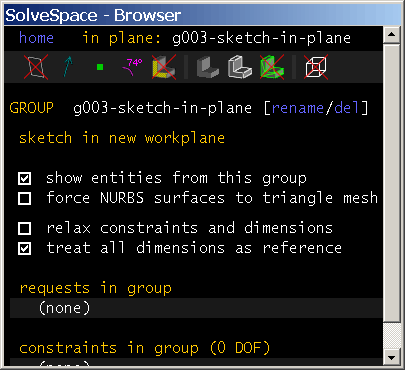
But, we don't want the dimensions in g003 to drive the geometry—we want them to be driven by the geometry, and just appear as labels. We could mark each dimension individually as a reference dimension, but that would be tedious (and they would all appear with "REF" next to the number, which is not what we want). So we wish to make all dimensions in this group behave as reference dimensions. We can do that by viewing the group's screen in the text window, by clicking its name in the list.
In the group's screen, we see a check box for "treat all dimensions as reference". We select that checkbox.
We now can place a dimension on some line or curve in the sketch; for example, we can select one of the little arcs on the inner contour, and choose Constrain → Diameter. The diameter of the arc is indicated on the sketch, as desired.
This dimension indicates the diameter of that arc, but does not define it. So if we drag the center of the arc, for example, then we see that the dimension changes. (Of course, if some other constraint were defining the diameter of the arc, then we wouldn't be able to modify that by dragging. But we never actually constrained the diameter, so it's free to change.)
We can repeat the process for whatever other dimensions we would like to indicate on the drawing. For example, we can select the two points at the far left and right of the sketch, and select Constrain → Distance, to indicate that width of 2.779". Or we can dimension any line's length or arc's diameter in the usual way. There is no need to worry about creating an inconsistent or redundant set of dimensions; since these are all just reference dimensions, that's not possible.

We can export our dimensioned drawing in the same way as before, by choosing File → Export View. Since only the constraints from the active group are shown on screen (regardless of whether other groups are shown; that affects only the lines and curves), we see only the reference dimensions that we placed in our special group. A separate group, with "treat all dimensions as reference" selected, is typically the best way to create a human-readable dimensioned drawing, if we want the dimensions on that drawing to be different from the ones used to specify the part.
This completes the tutorial. Other features in SolveSpace may be specially useful when drawing in 2d; for example, cut and paste work exclusively within workplanes. To learn more about these features, see the reference manual, or follow the prompts and messages within the program.